Trade Finance - Background
Trade Finance products are characterized by short average maturities, combined with low credit risk and default rates. In fact, it is one of the safest forms of financing with less than 1 percent of transactions facing default. During 2008–2021, default rates were 0.10 percent and 0.02 percent, respectively, for import and export letters of credit, while those for export/import loans were 0.18 percent over the same period (Table 1). Even when defaults happen, recovery rates are quick and high at 62.7 percent and 63.7 percent for import and export letters of credit, and 62.3 percent for export/import loans during the same period. In fact, default rate for export L/Cs declined in 2021 as compared to 2020 on an exposure (0.01 percent in 2021 versus 0.07 percent in 2020), obligor (0.05 percent versus 0.06 percent) and transaction weighted basis (0.01 percent versus 0.02 percent). The favourable risk profile of trade finance should ideally ensure adequate availability. However, periods of crisis have often witnessed a concomitant contraction in availability of trade finance.
Table 1: Default Rates in Trade Finance Instruments, 2008-2021 (%)
| Trade Finance Product | Exposure Weighted Default Rate | Recovery Rate | Expected Loss |
| Import letters of credit | 0.10 | 62.7 | 0.04 |
| Export letters of credit | 0.02 | 63.7 | 0.01 |
| Loans for import/export | 0.18 | 62.3 | 0.07 |
| Performance guarantee | 0.24 | 42.0 | 0.00 |
| Supply chain finance | 0.24 | - | - |
| Export finance | 0.62 | 95.2 | 0.03 |
Note: Exposure weighted default rate refers to bank-declared default weighted by the volumes of exposure in line with Basel methodology. Recovery rate is the extent to which principal and accrued interest on defaulted debt can be recovered. Expected losses refer to banks’ expected losses resulting from lending to borrowers that may default.
Source: ICC Trade Register Dashboard, ADB
Volumes of Trade Finance
Most of the trade finance products have witnessed a slowdown in the recent period. Letters of Credit (L/C) is a commonly used instrument in trade finance. SWIFT trade finance volumes are a good indicator of the overall use of L/Cs, as nearly 90 percent of these transactions are routed through SWIFT. During FY2016 to FY 2019, SWIFT trade finance traffic witnessed a decline (Exhibit 1). SWIFT trade finance volume fell 6.4 percent in 2019 from the year before, in large part due to a 5.9 percent drop in category 7 and 8.4 percent drop in category 4 traffic.
Exhibit 1: Global SWIFT Trade Traffic: Recent Trends (FY2016-FY2019)
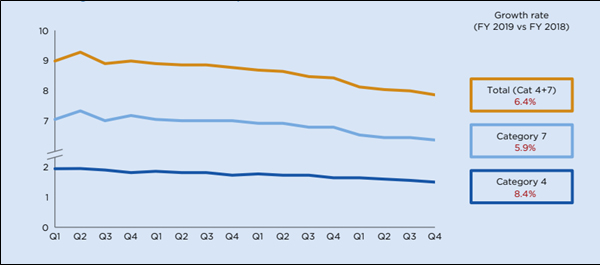
Note: Category 7 messages: Flows for commercial and standby letters of credit and guarantees Category 4 messages: Flows for documentary collections, excluding the three least commonly used “cash letter” messages
Source: ICC Global Survey on Trade Finance, 2020
The SWIFT trade related messages which were already relatively low in 2019, witnessed further decline in 2020 with the onset of COVID-19 pandemic, on account of the supply and demand disruptions globally. The trade related messages gradually increased with recovery in trading activities. Another major shock was witnessed during the start of 2022, as the global uncertainties grew due the Russia-Ukraine conflict. As per the latest data available, the y-o-y growth in trade related messages in SWIFT is once again slowing down, which could be attributed to the global slowdown in demand.
Exhibit 2: SWIFT Trade Related Messages (Y-o-Y Change)
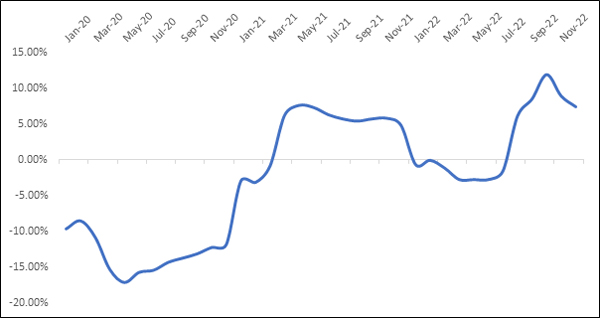
Note: Monthly values correspond to the growth in YTD value for the month.
Source: SWIFT FIN Traffic Document Centre, Exim Bank Research
The global export credit and insurance business witnessed a dip in 2020 due to the contraction in global trade during the year, but recovered strongly thereafter in 2021. New business volumes of Berne Union members increased from US$ 2,320 billion in 2017 to US$ 2,626 billion in 2021. A comparison of new business of Berne Union members with the world exports indicates that credit insurance had shown remarkable resilience and provided much needed support to trade during the COVID-19 crisis (Exhibit 3), as new business declined by a mere (-) 0.4 percent during 2020, as compared to a (-) 7.2 percent decline in global exports during the year.
Exhibit 3: New Business of Berne Union Members and Global Exports
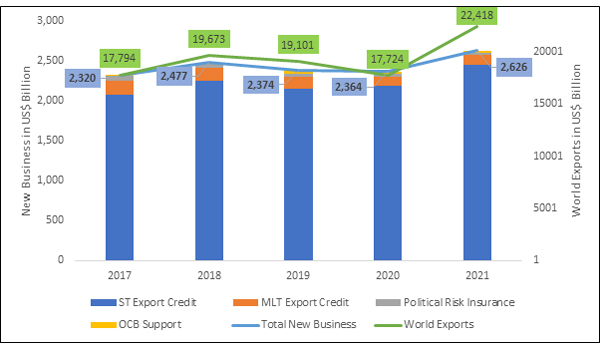
Note: OCB Support is Other Cross-border Support
Source: Berne Union, Exim Bank Research
Despite some narrowing of margins, trade and supply chain finance revenues recorded a y-o-y growth of 28 percent during 2021 on a nominal basis, reaching US$ 55 billion during the year, and even exceeding the 2019 revenues by 15 percent. This was due to the post-COVID-19 recovery in trade volumes. Going forward, revenues from trade finance products are expected to witness moderate growth and are expected to increase from the level of US$ 55 billion in 2021 to US$ 92 billion in 2030 (Exhibit 4). Trade finance revenues are expected to increase slightly faster than the volume of the underlying trade, a consequence not only of strong margins but of greater penetration of SME trade with digitised products and platforms. These expected gains would be even higher if not for likely price pressure due to increased competition from fintechs and non-banks.
Exhibit 4: Global Trade Finance Market Revenue
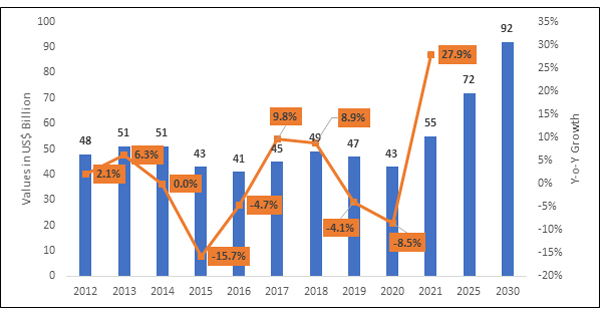
Note: Data for 2025 and 2030 is forecast
Source: ICC Trade Register Report 2022, Exim Bank Research
Trade Finance Gap
The trade finance gap has historically hovered around 7 percent–10 percent of global merchandise export values, hitting its highest level during the pandemic in 2020. According to the ADB, if merchandise trade value is assumed to grow about 15 percent in 2022, maintaining a trade finance gap of 10 percent would result in a trade finance gap of around US$ 2 trillion (Exhibit 5). If constraints on trade finance push banks to reject more trade finance proposals, the trade finance gap could be even larger.
Exhibit 5: Trade Finance Gap
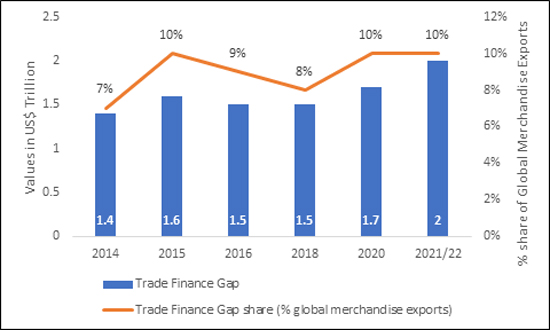
Note: Data for 2021/22 is a forecast
Source: ADB
